Sunday, August 9, 2009

Bilateral Graph

A bilateral graph is a histogram that can display different information such as location and amount, on one histogram. They are very useful in side-by-side comparisons. This is a bilateral graph of peoples approval of China's leadership and where the opinion is coming from.

http://media.gallup.com/poll/graphs/080429China2Graph2_GASJIDHUQfredo.gif

Bivariate Choropleth Map


A bivariate choropleth map is a choropleth map that displays more than one variable at a time, with different amounts of shading or with other different map layers. These maps can convey large amounts of information, such as this one about land use, per capita spending, and life expectancy in Africa.

Lorenz curve

The lorenz curve helps to visualize the cumulative distribution function, and it used mostly in economics. It is most commonly used to show the way income is distributed, and it usually represents the bottom % of households and the amount of money that they receive. 


http://www.google.com/imgres?imgurl=http://content.answers.com/main/content/img/oxford/Oxford_Geography/0198606737.lorenz-curve.1.jpg&imgrefurl=http://www.answers.com/topic/lorenz-curve&h=436&w=431&sz=27&tbnid=hwE39wO2MLKC8M:&tbnh=126&tbnw=125&prev=/images%3Fq%3Dlorenz%2Bcurve&usg=__Su0dmMx-rqkSoU1ikmc5-S75Dts=&ei=jmZ_SuiYNseOtgf35-zgAQ&sa=X&oi=image_result&resnum=4&ct=image

Univariate Choropleth Map


Univariate Choropleth maps are the standard choropleth map that displays only one variable with shading or different colors. This is a map of where the most hay is in the United States, with the darker green representing more.

Nominal Area Choropleth


Nominal area choropleth are maps with data that cannot be ordered any particular way or be shown any particular way except with colors. A great example would be this map, a map of the states and their electoral votes and who won the state. The data can be easily displayed in this format.

http://politicalmaps.org/wp-content/uploads/2007/12/2008-prediction-map-11252007.jpg

Index value plot


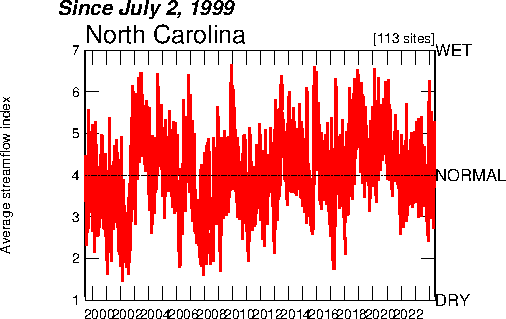
The index value plot can help to track data over a series of time. This plot shows the average streamflow in North Carolina, and keeps track of whether it was wetter and drier in relation to the historical data. 


http://images.google.com/imgres?imgurl=http://waterwatch.usgs.gov/regplots/real/real_nc_2.gif&imgrefurl=http://water.usgs.gov/waterwatch/%3Fm%3Dreal%26r%3Dnc%26w%3Dreal%252Cplot&usg=__vkTvnbBvoJv--Wb2BHENjNSJMNU=&h=450&w=550&sz=10&hl=en&start=17&um=1&tbnid=1sBUYWU8PsTYWM:&tbnh=109&tbnw=133&prev=/images%3Fq%3Dindex%2Bvalue%2Bplot%26hl%3Den%26client%3Dsafari%26rls%3Den-us%26sa%3DN%26um%3D1

Unclassed Choropleth Map


An unclassed choropleth map displayes categorical information without the same parameters as a classed choropleth map. This technique uses just shading to portray the information instead of shading and boundaries. This map displayes how republican and democratic the counties in the us voted.